
How to get jstack information
The jstack command-line utility attaches to the specified process or core file and prints the stack traces of all threads that are attached to the virtual machine, including Java threads and VM internal threads, and optionally native stack frames.
The stack trace analysis is helpful to resolve the problems related to java processes. Here is the instruction to get a stack trace by the jstack command.
Step 1. Obtain PID of the target process.
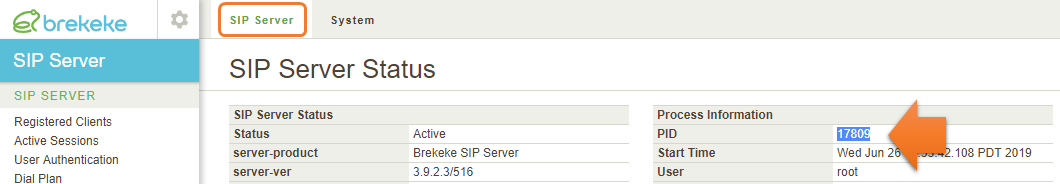
– PID can be obtained at the [Status] > [SIP Server] > [PID] field when you have access to the product admintool.
– When you don’t have access to the product admintool, get PID using the following commands.
Windows OS:
netstat -ano | findstr "5060"     <- To find out SIP SERVER process
netstat -ano | findstr "8080"     <- To find out Tomcat process*1
In the following example, “2152” is PID of the SIP server.
C:\Users\Nori>netstat -ano | findstr "5060"
UDP 0.0.0.0:5060 *:* 2152
UDP [::]:5060 *:* 2152
Linux OS:
lsof -i:5060     <- To find out SIP SERVER process
lsof -i:8080     <- To find out Tomcat process*1
In the following example, “1827” is PID of the SIP server.
[root@ccspef1 bin]# lsof -i:5060
COMMAND PID USER FD TYPE DEVICE SIZE/OFF NODE NAME
java 1827 root 62r IPv6 13257 0t0 UDP *:sip
java 1827 root 64r IPv6 13260 0t0 TCP *:sip (LISTEN)
*1. In the case Tomcat uses 8080 port for web service.
Step 2. Execute jstack
Execute jstack command*2 with the PID, and redirect the result to the file.
For example, if the PID is 1872:
jstack -l 1872 > jstack.txt
In the case that you need to get multiple jstack results like “execute the jstack command evey 5 seconds and get a result 3 times”, change output file names then execute the jstack command like below.
jstack -l 1872 > jstack1.txt
jstack -l 1872 > jstack2.txt
jstack -l 1872 > jstack3.txt
*2 “jstack” command is usually located at <JDK Install directly>/bin/.